This interactive water rocket simulation models real flight physics, including thrust, mass flow, drag, and acceleration.
It is designed for STEM education, engineering exploration, and informed rocket design before real launches.
Simulation Parameters
| Rocket Parameter | Value | Unit |
|---|---|---|
| Volume | liter | |
| Dry Mass | grams | |
| Diameter | mm | |
| Drag Coefficient | ||
| Nozzle Diameter | mm | |
| Positive Pressure | bar | |
| Water | liter | |
| External Parameter | ||
| Launch Tube Length | mm | |
Flight phases
| Phase | Height | Velocity | Time |
|---|
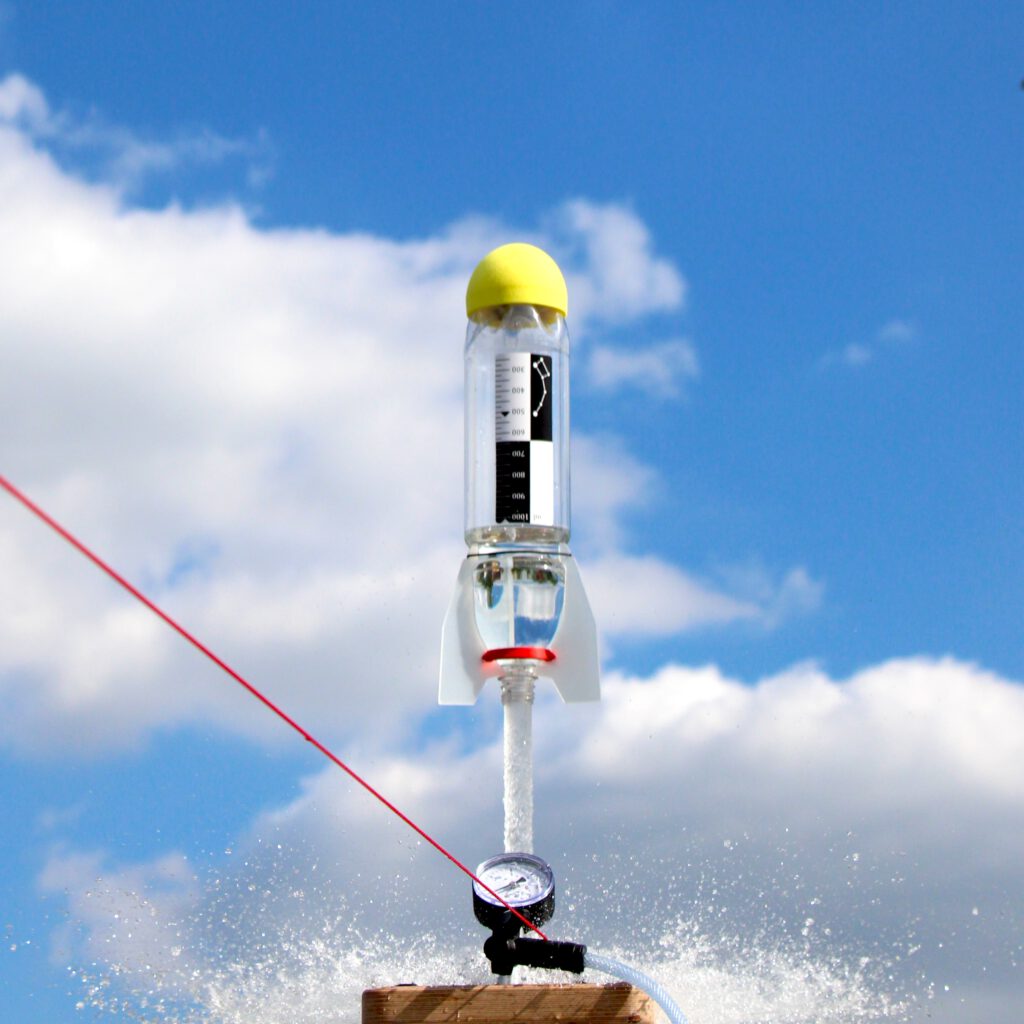
Simulation Graphics
Scientific Briefing: Understanding the Simulation
The simulation is structured into five consecutive flight phases, each governed by a distinct physical model. Phases 4 and 5 share the same underlying physics but represent different operational regimes within that model.
The numerical approach follows a time-marching scheme: an initial state is advanced to the next state by applying a small time step . The size of is not fixed; it is adapted to the dynamics of each phase. Rapid transients (e.g. launch and thrust phases) are resolved with smaller time steps, while slower, quasi-steady phases allow larger steps.
This phase-adaptive time stepping ensures numerical stability and accuracy while keeping the computation efficient. State variables such as mass, velocity, position, pressure, and forces are continuously updated at each step, and the final state of one phase serves as the initial condition for the next.
1. The Dynamics of Peak Velocity
Why maximum speed occurs before the end of the thrust phase.
In rocket physics, acceleration is dictated by the vector sum of all forces. A common misconception is that a rocket is fastest at the exact moment the fuel runs out (“Burnout”). However, Newtonian physics reveals a more subtle timing:
Your rocket reaches its maximum velocity at the precise moment of force equilibrium.
- Acceleration Phase: As long as the engine’s thrust exceeds the combined forces of gravity and aerodynamic drag, the rocket continues to accelerate.
- The Deceleration Point: Toward the end of the burn, the internal pressure (and thus the thrust) drops. The net acceleration becomes negative as soon as the thrust is less than the sum of gravity and drag.
The Result: Gravity and air resistance begin “braking” the rocket even while the engine is still producing residual thrust. You hit your peak speed at the balance point where these forces perfectly cancel each other out.
2. Geometric Modeling: How Your Rocket Takes Shape
The total length of your rocket is determined by strict geometric constraints required for accurate aerodynamic modeling. To calculate drag, we must translate your chosen volume into a physical body.
We utilize a segmented structural model:
- Nose Cone: An aerodynamic hemisphere.
- Transition: A conical frustum.
- Nozzle: Specialized geometry at the aft section.
The remaining volume defines the length of the cylindrical main body. While the length does not alter the internal ballistics of the engine, it is the primary factor in determining Skin Friction Drag (viscous resistance). If the volumes are mathematically inconsistent, the system reverts to a robust cylindrical reference model to ensure simulation stability.
3. Aerodynamics & Stability: Finding the “Sweet Spot”
The Drag Coefficient ( or ) is a vital tool for understanding how your rocket’s shape affects its performance. Your challenge is to experiment with different geometries to find the “Sweet Spot”—the point where the rocket remains aerodynamic and stable without excessive surface friction.
Note on our Calculation:
The value provided below the data table is not simulated, but calculated as an estimated guideline.
- Methodology: This estimation is derived from the rocket’s specific geometry—including length, diameter, and fin dimensions—alongside internal physical parameters that are difficult to measure precisely.
- Interpretation: Due to inherent uncertainties, this value should be viewed as a comparative design parameter rather than an exact aerodynamic prediction.
- Application: You can manually enter this calculated value into the simulation to refine your flight predictions. Typical values for model rockets usually fall between 0.15 and 0.75.
Stability and Fin Design
Fins provide the necessary restoring force to keep the aerodynamic center behind the center of mass. However, air resistance is strongly influenced by fin surface area; therefore, fins should only be as large as necessary to ensure stability.
- Scaling Logic: In our calculations, the fin width is set equal to the rocket’s radius, and the fin length is three times that width. Consequently, fin size scales with the rocket’s radius. Slimmer rockets utilize smaller fins, mirroring real-world rocket design practices.
- Detailing: Sharp edges and rough surfaces significantly increase drag. Use smooth surfaces and gentle transitions to maintain a streamlined shape.
The Fundamental Design Trade-off
By adjusting the geometry, you can observe how the value changes qualitatively:
- Slimmer Rockets: Reducing the diameter lowers the frontal area (form drag). However, to maintain the same volume, the rocket must become longer, which increases skin friction.
- Fineness Ratio: High-performance models typically aim for a ratio (length to diameter) of at least 4:1 to 6:1.
- The Conflict: If a rocket is excessively long, the increased surface area can outweigh the benefits of a slim profile.
Our approach allows you to evaluate this influence directly, comparing slim, long rockets with shorter, wider ones to determine which geometry achieves the maximum flight altitude while keeping all other parameters identical.
4. PET Fraction – Structural Minimum Estimate
The displayed value represents the theoretical minimum PET mass required for the cylindrical pressure vessel at the selected internal pressure.
The required wall thickness is calculated using the thin-walled cylinder model and the governing hoop stress condition:
where
internal pressure
cylinder diameter
wall thickness
= tensile strength of the material
The tensile strength describes the maximum stress the material can withstand before failure in tension. For biaxially oriented PET produced by stretch-blow molding, a value of approximately 150 MPa is assumed.
The minimum PET mass is then estimated from the cylindrical surface area, the calculated wall thickness, and the density of PET. The result represents a theoretical structural lower bound for the pressure shell only. Nose cone, ballast mass, fins, nozzle hardware, and payload are not included. In practical rocket designs, the total rocket mass is typically about 2–3 times higher than this minimum pressure-shell estimate.
The value should therefore be interpreted as a structural reference, not as a complete rocket mass prediction.